


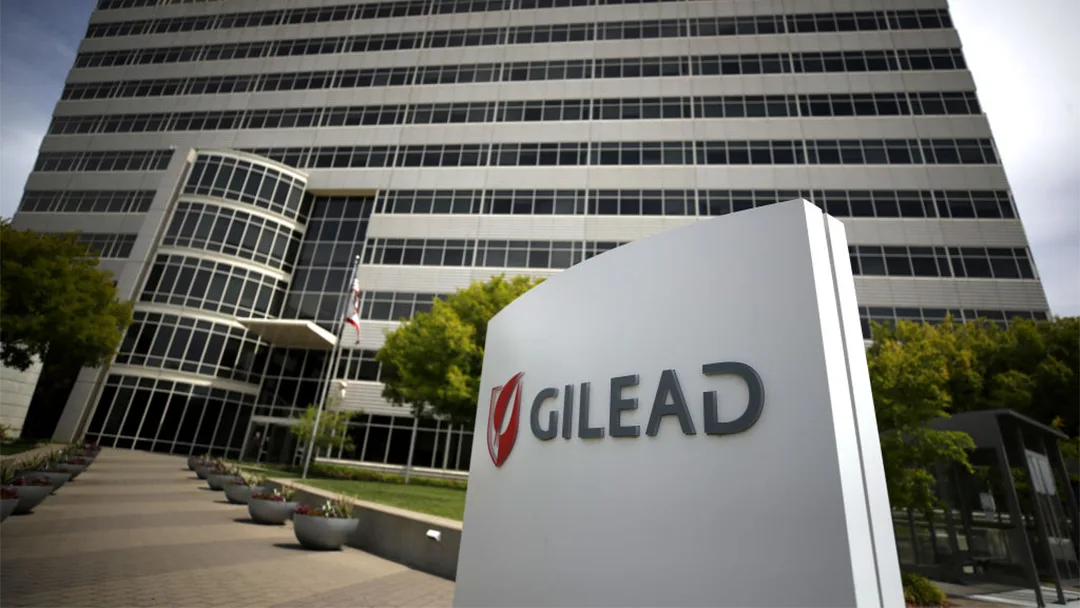
Gilead Sciences, Inc. (NASDAQ: GILD) announced second-quarter 2026 financial results with total revenues of USD 7.8 billion, representing a 10% year-over-year increase. Product sales reached USD 7.6 billion (+8% YoY), or +10% excluding Veklury, primarily driven by strong HIV product performance, Trodelvy growth, and Livdelzi demand, partially offset by declines in Cell Therapy and HCV products. The quarter highlighted Gilead’s successful portfolio diversification beyond its traditional antiviral franchises.
Financial Highlights | Q2 2026
| Metric | Q2 2026 Result | YoY Change |
|---|---|---|
| Total Revenue | USD 7.8 billion | +10% |
| Product Sales | USD 7.6 billion | +8% |
| Product Sales (ex-Veklury) | Not specified | +10% |
| HIV Portfolio Sales | USD 5.7 billion | +12% |
| Liver Disease Sales | USD 877 million | +10% |
| Cell Therapy Sales | USD 417 million | -14% |
| Veklury Sales | USD 23 million | -81% |
Therapeutic Area Performance
HIV Franchise Dominance
- Total HIV Sales: USD 5.7 billion (+12% YoY)
- Biktarvy: USD 3.8 billion (+7% YoY), maintaining market leadership in integrase inhibitor segment
- Descovy: USD 967 million (+48% YoY), exceptional growth driven by expanded indications and market share gains
Oncology Portfolio Growth
- Trodelvy (sacituzumab govitecan-hziy): USD 457 million (+26% YoY), driven by higher demand across multiple tumor types
- Strategic Significance: Represents Gilead’s successful expansion into solid tumor oncology following Immunomedics acquisition
Liver Disease Portfolio Resilience
- Total Liver Disease Sales: USD 877 million (+10% YoY)
- Livdelzi: Strong demand contributing to growth
- Chronic HBV Products: Continued steady performance
- Hepcludex (bulevirtide-gmod): Contributing to portfolio diversification
- HCV Offset: Lower HCV sales partially offset growth from newer liver disease assets
Cell Therapy Challenges
- Total Cell Therapy Sales: USD 417 million (-14% YoY)
- Yescarta: USD 346 million (-12% YoY)
- Tecartus: USD 70 million (-24% YoY)
- Primary Driver: Competitive pressures in CAR-T market from emerging alternatives and pricing dynamics
COVID-19 Impact
- Veklury: USD 23 million (-81% YoY), reflecting dramatically reduced COVID-19 hospitalization rates
- Portfolio Diversification Benefit: Minimal impact on overall results due to successful diversification strategy
Strategic Portfolio Transformation
Success Factors
- HIV Leadership: Continued dominance in HIV market with premium-priced Biktarvy and expanding Descovy franchise
- Oncology Integration: Successful commercial execution of Trodelvy post-acquisition
- Liver Disease Evolution: Transition from declining HCV to growing HBV and rare liver disease portfolio
- Risk Mitigation: Reduced dependency on pandemic-driven Veklury revenue
Challenge Areas
- Cell Therapy Competition: Increasing competitive intensity in CAR-T space requiring strategic response
- Market Saturation: Potential headwinds in mature HIV market despite current growth
- Pricing Pressure: Ongoing reimbursement challenges across therapeutic areas
Market Implications
- Diversification Validation: Gilead’s strategic shift from pure antiviral company to diversified biopharma is yielding results
- Oncology Credibility: Trodelvy’s strong performance validates Gilead’s oncology ambitions and M&A strategy
- Cash Generation: Robust profitability supports continued pipeline investment and shareholder returns
- Competitive Positioning: Well-positioned against peers through balanced portfolio across high-growth therapeutic areas
The Q2 2026 results demonstrate Gilead’s successful navigation of portfolio transitions while maintaining strong financial performance through strategic diversification and commercial excellence.
Forward‑Looking Statements
This brief contains forward-looking statements regarding financial performance, product sales, and business outlook. Actual results may differ materially due to competitive pressures, regulatory developments, market adoption rates, and macroeconomic conditions.-Fineline Info & Tech